The default reports in “Totals,” present an average of each performance metric across the selected time period.
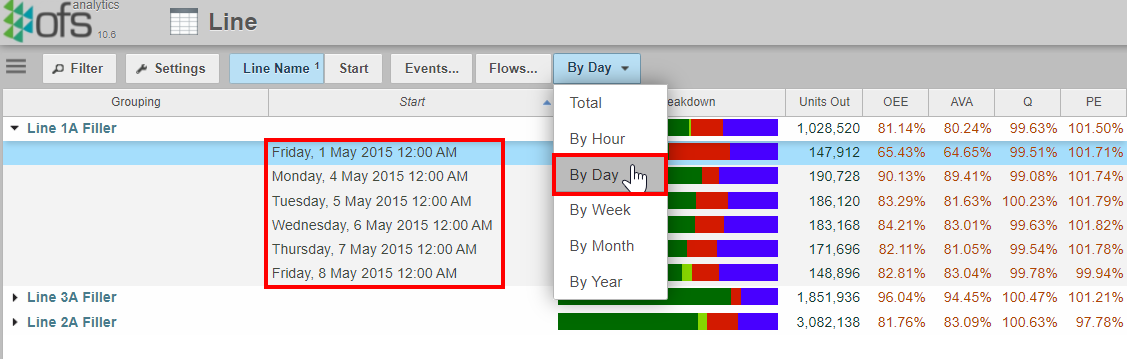
Using the drop-down, you can find the average figures within a smaller variant of time.
A Line and Reason report can break down OEE and other metrics by the hour, day, week, month or year.
Job data e.g. Batch Number, can be viewed by selecting “By Job”. This exists in a Product Report and a Reason by Product Report.

Performance data of singular shifts “By Shift” can be found in Line by Crew and Reason by Crew Report.

In the Product by Crew report, the “By Job By Shift” aggregation provides the most granular scale of time as it looks at both the shift, as well as all the jobs that ran within that shift.
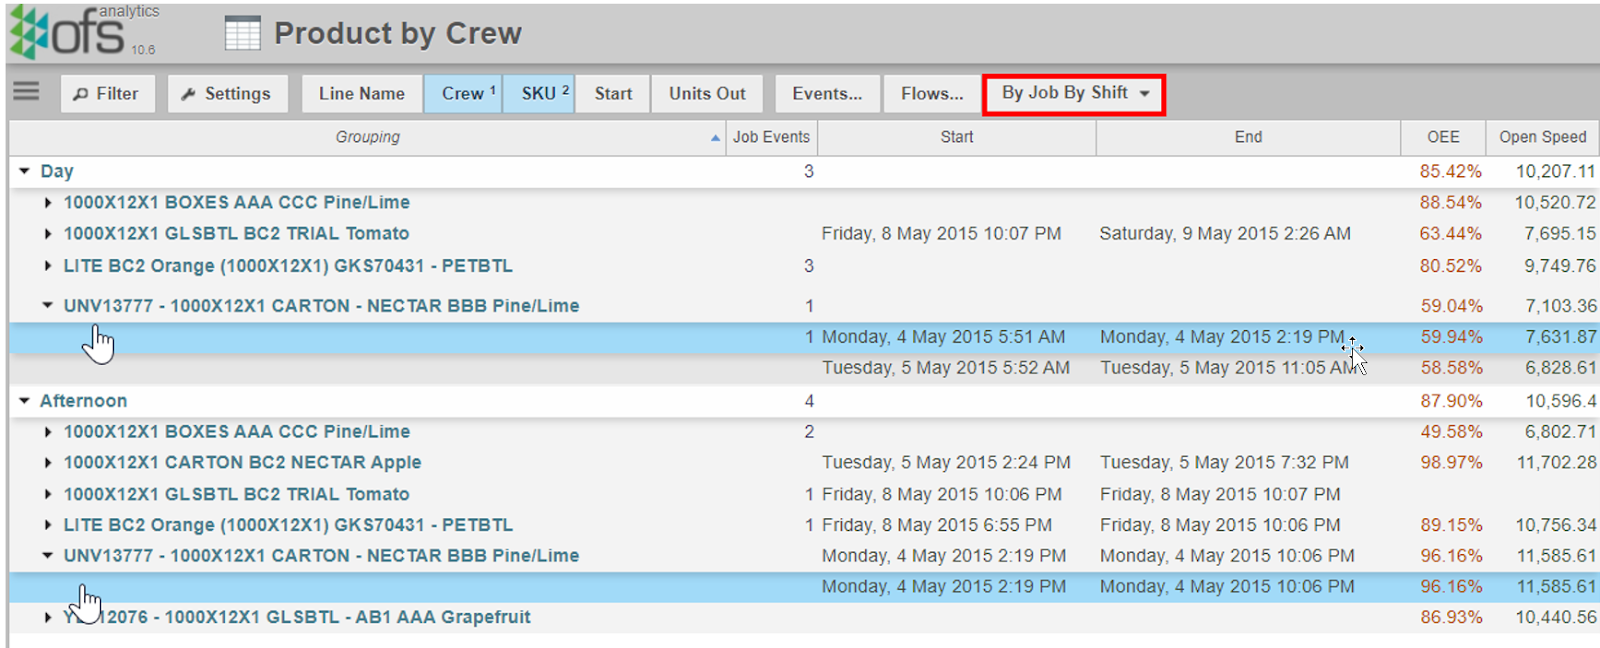
In the example above, the Day Crew started the Nectar Pine Lime job on 4th May at 5:51am, then was continued by the Afternoon Crew at 2:19pm when the shifts swapped.