---
title: How to add and customise reports on the Portal?
description: This article covers how to add a report and customize different reports on the portal.
---
[Skip to content](https://support.ofsystems.com/how-to-add-and-customize-reports-on-the-portal#main-content)
![OFS\_Circle.png\]](https://support.ofsystems.com/hs-fs/hubfs/OFS_Circle.png?height=45&name=OFS_Circle.png)
- [OFS Customer Portal](https://support.ofsystems.com/)
- [Main Website](https://ofsystems.com/)
- [Contact Us](https://www.ofsystems.com/contact-us?)
- [Service Portal](https://ofsystems.atlassian.net/servicedesk/customer/portal/1)
Open main navigation
Close main navigation
- [OFS Customer Portal](https://support.ofsystems.com/)
- [Main Website](https://ofsystems.com/)
- [Contact Us](https://www.ofsystems.com/contact-us?)
- [Service Portal](https://ofsystems.atlassian.net/servicedesk/customer/portal/1)
Welcome to the OFS Customer Portal
- There are no suggestions because the search field is empty.
1. [OFS Customer Portal](https://support.ofsystems.com/?hsLang=en)
2. [How To Questions](https://support.ofsystems.com/how-to-questions?hsLang=en)
3. [Analytics](https://support.ofsystems.com/how-to-questions?hsLang=en#analytics)
# How to add and customise reports on the Portal?
## The Portal lets you build a wall display or office dashboard from multiple report widgets, each with its own report, lines, and date range.
#### **Step 1 — Open the Portal**
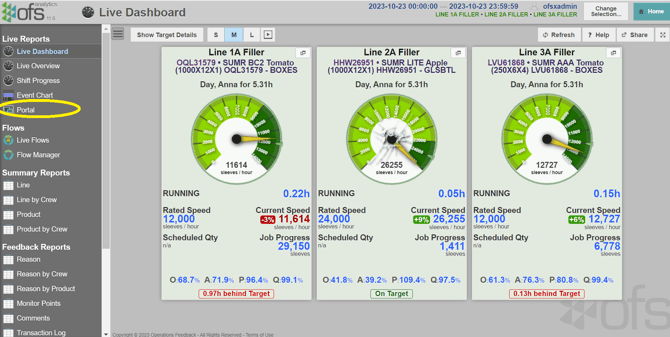
Open **Analytics** and click **Portal**.
****
#### **Step 2 — Add a report**
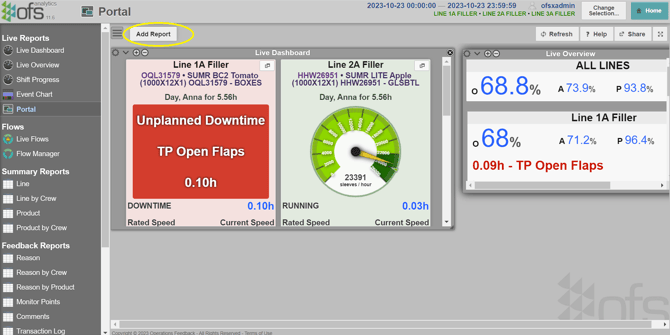
Click **Add Report**. This adds a new widget, defaulting to **Live Dashboard**.
#### **Step 3 — Open the widget's settings**
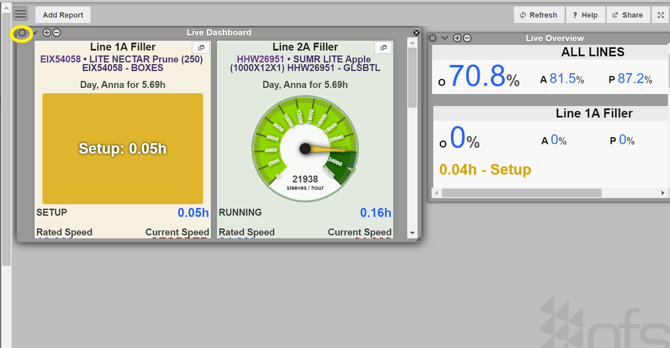
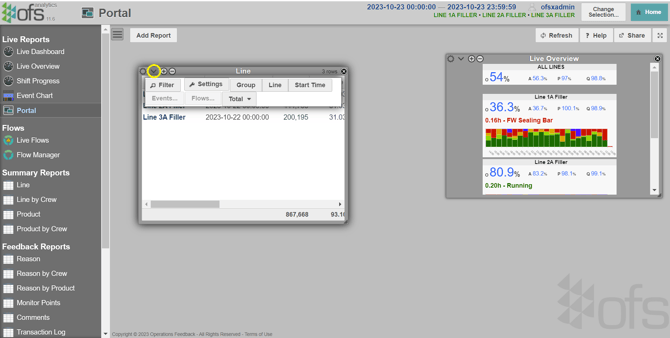
Click the gear icon on the widget's title bar.
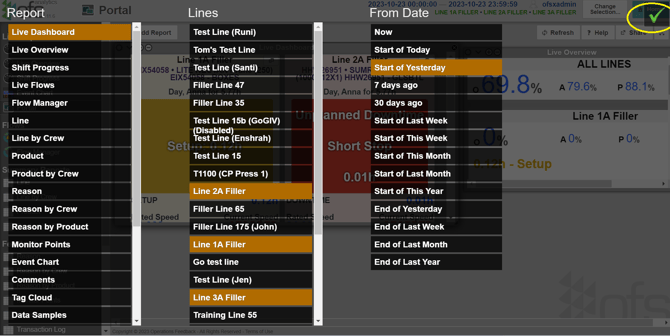
This opens a full-screen picker with four columns: **Report**, **Lines**, **From Date**, **To Date**.
There's no cancel option in this panel — pressing **Escape** won't close it. Whatever is highlighted when you click the green confirm tick is what gets applied, so check your selection before confirming.
#### **Step 4 — Choose the report, lines, and date range**
Select the **Report**, **Lines**, **From Date** and **To Date**, then click the green confirm tick.
****
Each widget keeps its own report, lines and date range — a widget doesn't follow the date range set in the Analytics header, so different widgets on the same Portal can be showing different periods.
#### **Step 5 — Customize the report further**
Use the chevron icon on the widget's title bar to customize the report's columns and grouping buttons further.
**A Portal layout is stored in your browser, not on the server.** It won't follow you to another machine or browser, and clearing your browser's site data will delete it with no way to recover it. To move a Portal layout between machines, share the link instead.
Watch a video on adding and customizing reports on the Portal: [Event Chart and Portal](https://support.ofsystems.com/event-chart-and-portal?hsLang=en&)
- [Getting Started](https://support.ofsystems.com/getting-started?hsLang=en#main-content)
- [Console: The Basics](https://support.ofsystems.com/getting-started?hsLang=en#console-the-basics)
- [Analytics: The Basics](https://support.ofsystems.com/getting-started?hsLang=en#analytics-the-basics)
- [Fusion Manager: The Basics](https://support.ofsystems.com/getting-started?hsLang=en#fusion-manager-the-basics)
- [OFS-Flow Training : The Basics](https://support.ofsystems.com/getting-started?hsLang=en#ofs-flow-training-the-basics)
- [OFS-Go](https://support.ofsystems.com/getting-started?hsLang=en#ofs-go)
- [MayvnAI](https://support.ofsystems.com/getting-started?hsLang=en#mayvnai)
- [Help & Support](https://support.ofsystems.com/help-support?hsLang=en#main-content)
- [Troubleshooting](https://support.ofsystems.com/help-support?hsLang=en#troubleshooting)
- [OFS in a Box](https://support.ofsystems.com/help-support?hsLang=en#ofs-in-a-box)
- [Routers](https://support.ofsystems.com/help-support?hsLang=en#routers)
- [PLCs](https://support.ofsystems.com/help-support?hsLang=en#plcs)
- [Success with MayvnAI](https://support.ofsystems.com/success-with-mayvnai?hsLang=en)
- [Training Videos](https://support.ofsystems.com/training-videos?hsLang=en#main-content)
- [Operator Console](https://support.ofsystems.com/training-videos?hsLang=en#operator-console)
- [OFS Analytics](https://support.ofsystems.com/training-videos?hsLang=en#ofs-analytics)
- [Fusion-Manager](https://support.ofsystems.com/training-videos?hsLang=en#fusion-manager)
- [OFS-Flow](https://support.ofsystems.com/training-videos?hsLang=en#ofs-flow)
- [OFS-Go](https://support.ofsystems.com/training-videos?hsLang=en#ofs-go)
- [How To Questions](https://support.ofsystems.com/how-to-questions?hsLang=en#main-content)
- [Administration](https://support.ofsystems.com/how-to-questions?hsLang=en#administration)
- [Operator Console](https://support.ofsystems.com/how-to-questions?hsLang=en#operator-console)
- [Analytics](https://support.ofsystems.com/how-to-questions?hsLang=en#analytics)
- [Fusion Manager](https://support.ofsystems.com/how-to-questions?hsLang=en#fusion-manager)
- [Fusion Manager - Alerts & Services](https://support.ofsystems.com/how-to-questions?hsLang=en#fusion-manager-alerts-services)
- [Flow](https://support.ofsystems.com/how-to-questions?hsLang=en#flow)
- [Flow - Validations](https://support.ofsystems.com/how-to-questions?hsLang=en#flow-validations)
- [Flow - Conditional Expression & Triggers](https://support.ofsystems.com/how-to-questions?hsLang=en#flow-conditional-expression-triggers)
- [APIs](https://support.ofsystems.com/how-to-questions?hsLang=en#apis)
- [FAQs](https://support.ofsystems.com/faqs?hsLang=en#main-content)
- [Operator Console](https://support.ofsystems.com/faqs?hsLang=en#operator-console)
- [Fusion Manager](https://support.ofsystems.com/faqs?hsLang=en#fusion-manager)
- [Analytics](https://support.ofsystems.com/faqs?hsLang=en#analytics)
- [OFS-Flow](https://support.ofsystems.com/faqs?hsLang=en#ofs-flow)
- [Case Studies](https://support.ofsystems.com/case-studies?hsLang=en#main-content)
- [Mavyn AI](https://support.ofsystems.com/case-studies?hsLang=en#mavyn-ai)
- [OFS Guides](https://support.ofsystems.com/ofs-guides?hsLang=en)
- [Webinars](https://support.ofsystems.com/webinars?hsLang=en)
[](http://ofsystems.com)
Operations Feedback Pty Ltd
7/627 Chapel St, South Yarra, VIC 3123
+61 3 8684 9859
[mailto:support@ofsystems.com](mailto:support@ofsystems.com)
Copyright © 2025, Operations Feedback Systems Pty Ltd.